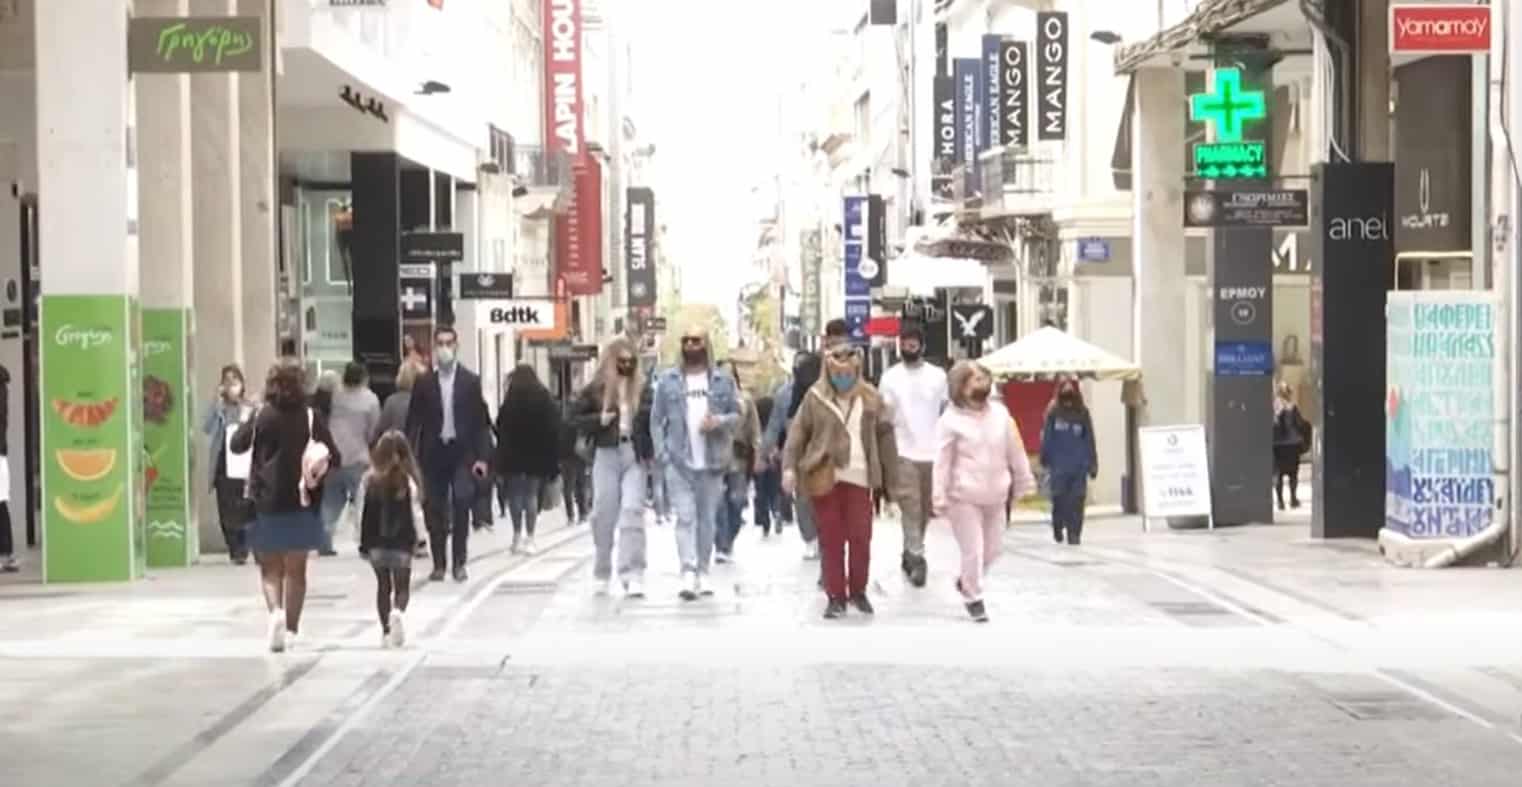
Despite the steady increase of 20 to 40 euros per year in the amount Greek households spent on consumption between 2016 and 2019, the lockdown depressed it to its lowest levels since the beginning of the 21st century. So, the average annual household expenditure on purchases contracted, according to ELSTAT data, in 2020 to 15,981.96 euros or 1,331.83 per month, a decrease of 9.9% from 2019. It was thus not only EUR 788.57 or 37.2% below the pre-crisis level and the 2008 level of EUR 2,120.40 per month, but also EUR 644.11 or 32.6% lower than the 1999 level of EUR 1,975.94, thus setting a negative record for the euro era and, typically, for a century and a millennium.
Based on official ELSTAT data, 50% of households spend less than €1,080 per month, with households living in rented accommodation spending a fifth (19.8%) of their budget on rent.
The poorest households consume simply to survive, as the share of average expenditure on food and non-alcoholic beverages and housing of the poorest 20% households is 58.2% of household expenditure, while the share of the richest 20% is 29%.
The highest average annual expenditure was recorded in Attica (18,401.52 euros), while the lowest in Central Greece (11,193.24 euros).
The largest share of the average household budget expenditure is on food and non-alcoholic beverages (23.1%), housing (15.3%) and transport (12.3%), while the smallest share (3.5%) is on recreational and cultural services.
The largest annual decreases in household expenditure were in recreation and culture (-36.4%), restaurants, cafes and hotels (-35.4%) and clothing and footwear (-27.4%).
Inequality and poverty risk
The share of average equivalent expenditure of the richest 20% of the population is 4.8 times larger than the share of the poorest 20% (5.4 for 2019). Households of the poorest 20% of the population reduced their expenditure compared to 2019 by 2.5%, while households of the richest 20% of the population reduced their expenditure by 13%.
- The share of the average equivalent expenditure on food items of the poorest 20% was 35.5% of household expenditure, while the share of the richest 20% of the population was 15.6%.
– Poverty risk threatens 15.6% of the population when only the equivalent expenditure on the purchase mode of acquisition is taken into account in the calculation of the indicator (17.1% in 2019), while the indicator decreases to 11.9% of the population (12.2% in 2019) when all consumption expenditure is taken into account, regardless of the mode of acquisition (imputed rent from owner-occupation, self-produced goods, goods and services provided free of charge by the employer, other households, non-profit organisations, the state, etc.).
Households living in urban rural areas spend on average €1,404.28, while those living in rural areas spend €1,085.33 per month or 22.7% less than households living in urban areas.