
PhytoEpignosi is the first free Greek platform for the standard analysis and diagnosis of the health of Greek crops using photos that farmers can take themselves.
What might high-yield, sustainable agriculture look like? PhytoEpignosi examines how analyzing images taken from fields can help farmers understand the typical response of their crops(relatively healthy vs. relatively unhealthy). Farmers can use this information to optimize their farming techniques.
The platform already has over 9,000 listings.
The crop health analysis and diagnosis program is available for free here:
How does it work (step by step)?;
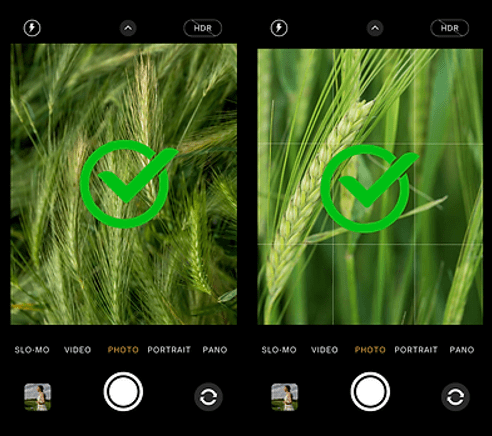
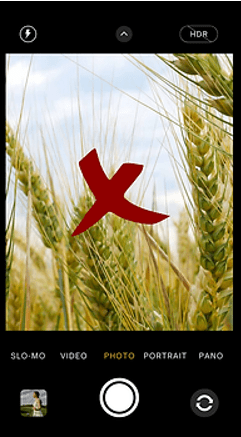
Step 1 – Take photos: Take photos of your crop using a camera or a cell phone. Make sure the images represent different areas of your field and are taken during the flowering and leaf growth stages. In general, it is recommended to use the program when the crop has reached 85–95% leaf development. Examples of how to take the photos are provided below. The photos should include details of the crop and not the horizon. The photos must clearly show parts of the crop; the larger the area shown, the better.
Step 2 – Upload the photos to the platform that generates a color histogram of your crop: https://www.christosapostoloudev.eu/phytoepignosi
Step 3 – Get your results through the PhytoEpignosi platform:
Analysis of the histograms derived from the photos that each user uploads to the platform:
a. Normalized Distribution: Check whether the histograms show a relatively uniform distribution across the entire range of intensity values. A healthy image should have a balanced color distribution and not be overly skewed toward a specific color.
b. Red Channel: Examine the histogram of the red channel. A healthy crop will typically have a significant amount of red in its leaves, indicating good chlorophyll content. However, an excessive amount of red may indicate stress or overexposure.
c. Green Channel: Check the histogram of the green channel. A healthy crop should have a relatively high amount of green, as this indicates good chlorophyll content and active photosynthesis.
d. Blue Channel: Analyze the histogram of the blue channel. A healthy crop may have a moderate amount of blue, but excessive blue may indicate stress or water-related problems.
e. Color Balance: Consider the balance among the three channels. A balanced representation of all three colors usually indicates a healthy crop.
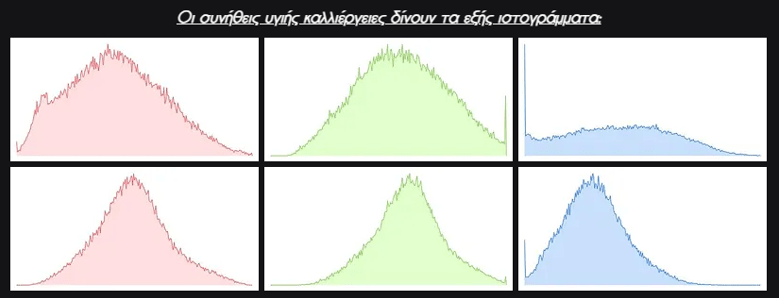
The crop health analysis and diagnosis program is available for free here:
Some information about the PhytoEpignosi program:
For farmers to benefit from precision agriculture or site-specific crop management, computers must be able to extract useful information from raw data. Computers interpret a digital image as a series of light intensity values for the colors red, green, and blue. Each pixel in the image stores the intensity values for these three colors, ranging from 0 (dark) to 255 (maximum light intensity). The combined value of the three colors determines the color of each pixel. By analyzing image histograms, we can extract valuable information.
A program for analyzing histograms of crop images offers many advantages for distinguishing between healthy and unhealthy crops:
- Lower cost: The histogram analysis program can be implemented on any device with a camera, such as a smartphone or a basic camera. It does not require the use of expensive drones or specialized equipment, thereby reducing implementation costs.
- Ease and convenience: Histogram analysis can be performed automatically or semi-automatically using specialized features of the PhytoEpignosi software, making the process much easier and more convenient.
- Wide coverage and high repeatability: The program can perform histogram analysis on large crop areas in a short period of time, repeating the check regularly without restrictions.
Image histograms show the statistical distribution of light intensity values in an image. They show how many pixels have a specific intensity value. We can use histograms for individual color channels to analyze images of rural areas and crops. The analysis of histograms can provide information for the assessment and monitoring of soils and crops. By analyzing the “color” of soils and crops through histogram analysis, we can obtain information regarding the condition and health of plants, the soil’s nutrient levels, and the amount of “green” in an area. With this information, farmers can monitor crop growth, detect any problems or diseases, and make decisions regarding the further care and management of their crops. Using machine learning algorithms and training on large volumes of data, we create a model that identifies the conclusions that can be drawn from the histograms and provides this information to the farmer. A computer can estimate the amount of “green” coverage in an area by examining the distribution of light intensity in specific regions of the color spectrum that correspond to the color of “green” and provide results not only regarding the unhealthy condition of a field but also for the identification of weeds in a field.
An RGB image histogram is displayed as three separate histograms, one for each channel of the RGB color space (R, G, and B).
- X-axis (horizontal axis): Typically, the X-axis represents the various values of the individual R, G, and B channels. Depending on the pixel being examined, the R, G, and B values range from 0 to 255. Thus, the channel values are plotted along the X-axis.
- Y-axis (vertical axis): The Y-axis represents the frequency of occurrence of the individual values of the R, G, and B channels in the image. Perpendicular to the X-axis, the values on the Y-axis correspond to the number of pixels that have those specific values. Thus, the histogram shows us how many times each R, G, and B value appears in the image.
RGB histograms help us understand the distribution of colors in an image and allow us to extract information about color rendering and contrast.
Bibliography:
- Ranganathan, J (Dec. 3, 2013) “The Global Food Challenge Explained in 18 Graphics,” World Resources Institute. Retrieved April 20, 2017.
- Broughton, J (July 6, 2015) “How Farmers Are Harvesting Big Data,” Inc. Retrieved April 18, 2017.
- Rutter, A (March 31, 2016) Case Study: Why This Farmer Says FarmLogs Will Save Him $16,000 a Year FarmLogs. Retrieved May 8, 2017.
- Lukina, E.V. et al. (1999) “Estimating Vegetation Coverage in Wheat Using Digital Images,” *Journal of Plant Nutrition*, vol. 22. Retrieved April 18, 2017.
- McHugh, S (n.a.) Camera Histograms: Luminosity & Color. Cambridge Colour. Retrieved April 18, 2017.
The crop health analysis and diagnosis program is available for free here:
These applications were created by Christos Apostolou (Bachelor of Science in Agricultural Science).
For any information, please contact Christos Apostolou at info@christosapostoloudev.eu ή capostolouagr@yahoo.com